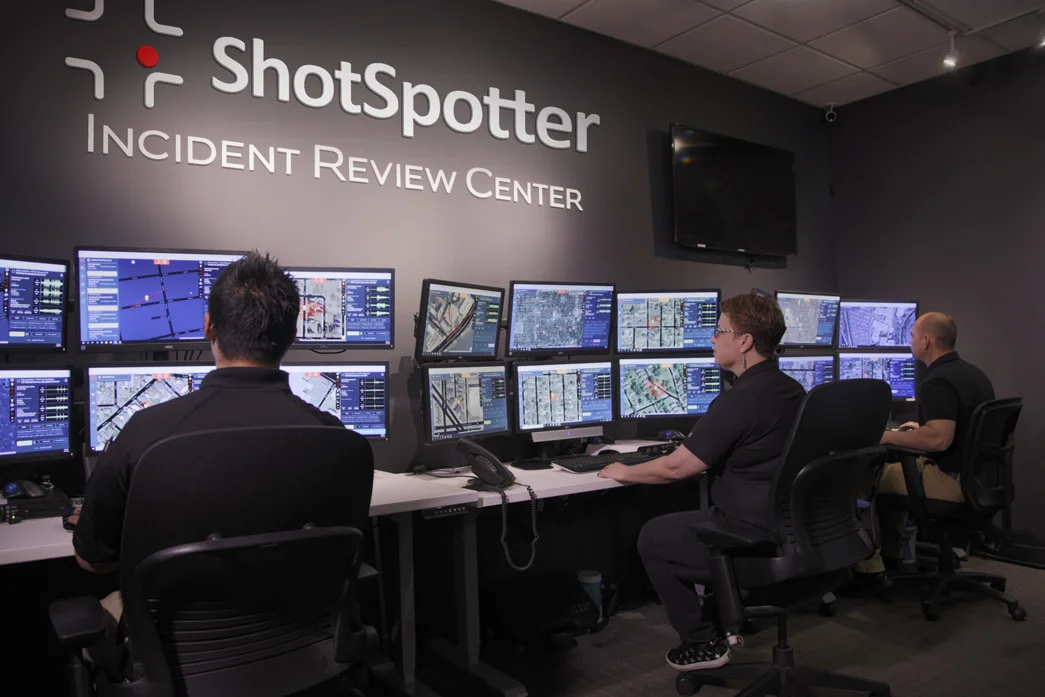
This is why we are excited to introduce the CrimeTracer Crime Map, a community-focused feature that functions like a public-facing CompStat report, enabling the public to see the same information as the police on what crimes are occurring in their area. In this blog, we’ll review some of Crime Map’s capabilities.
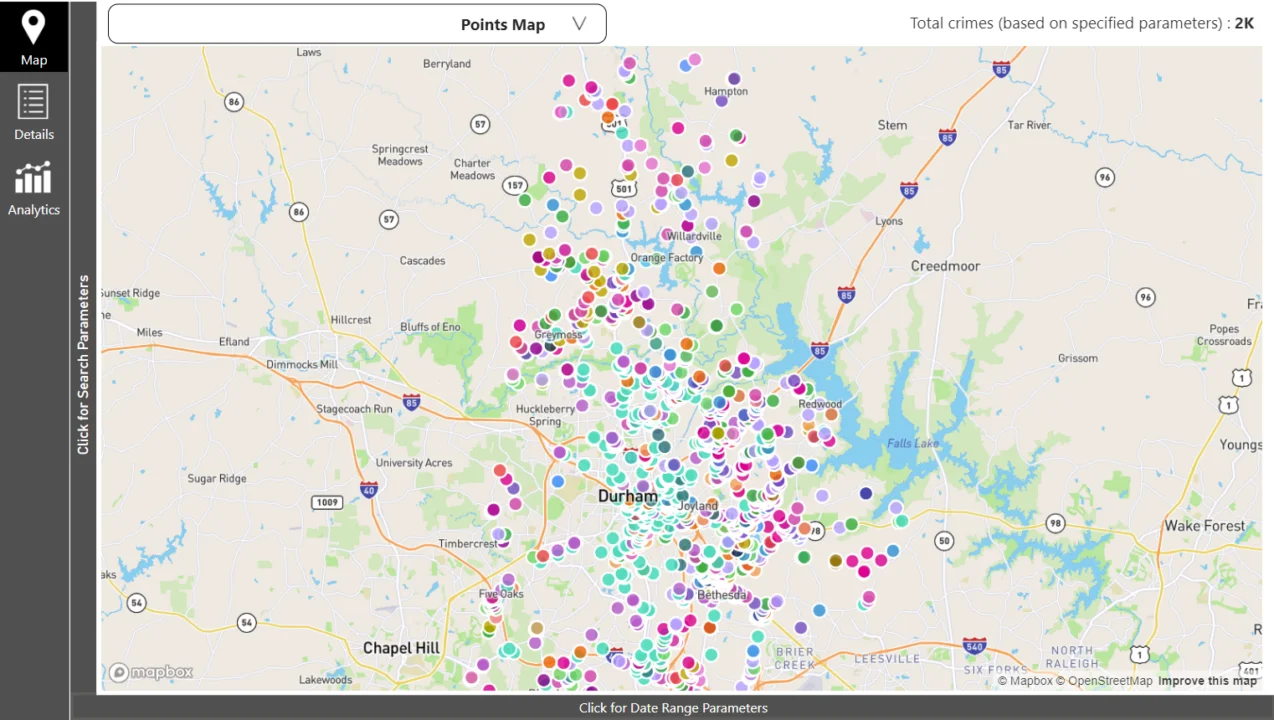
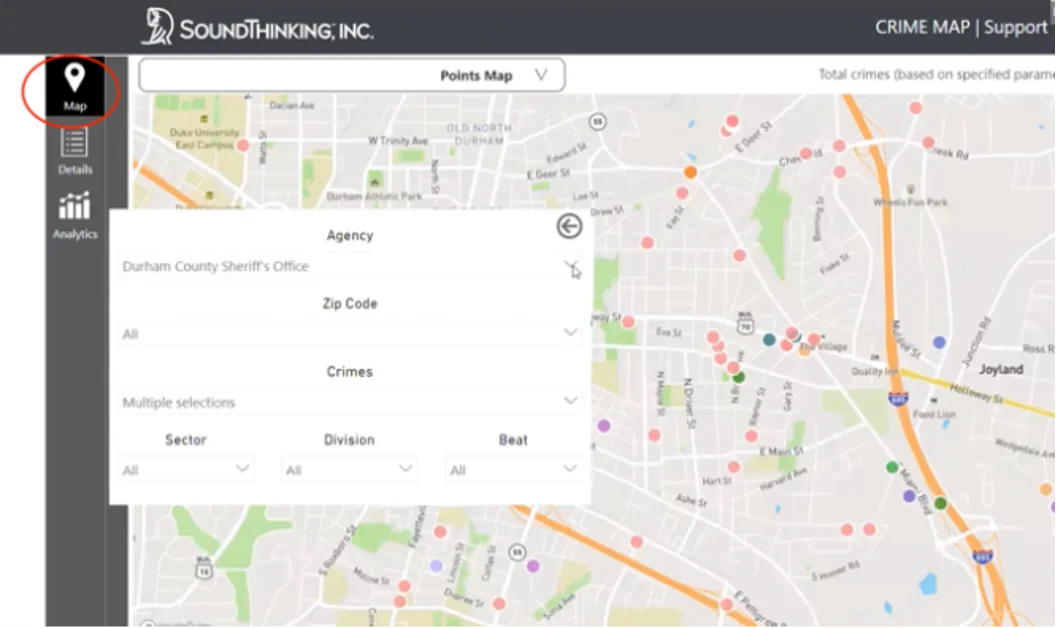
The CrimeTracer Crime Map at a glance.
With this feature, the public can view all the crimes in their area or in an area of interest and use the information to engage in a dialog with their agency on these occurrences. Crimes are denoted by pins, color-coded by crime type.
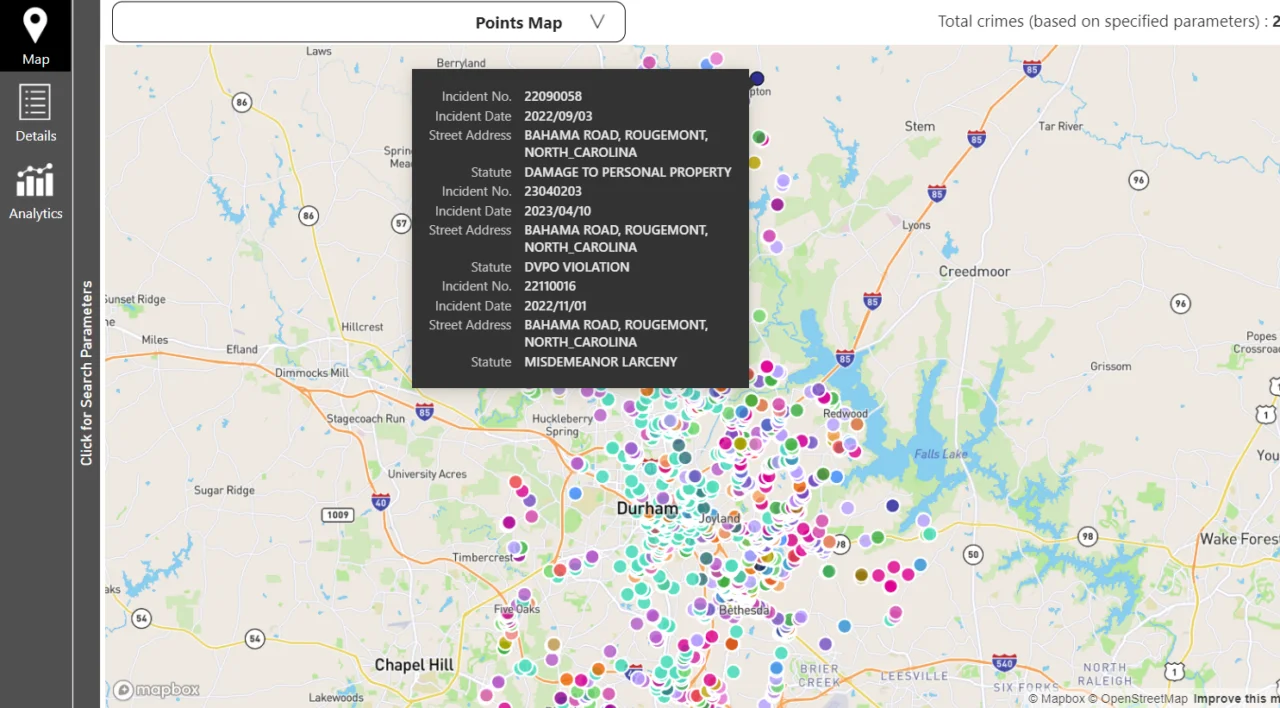
Hovering over a pin displays the incident number, street address (kept at the street level, for safety reasons), and the statute for the crime.
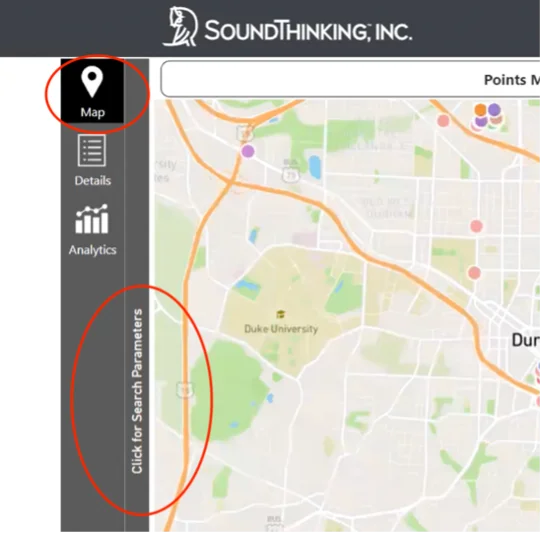
By clicking on the search parameters, the public can filter this data by different agencies, different areas, zip code, or by NIBRS crime type.
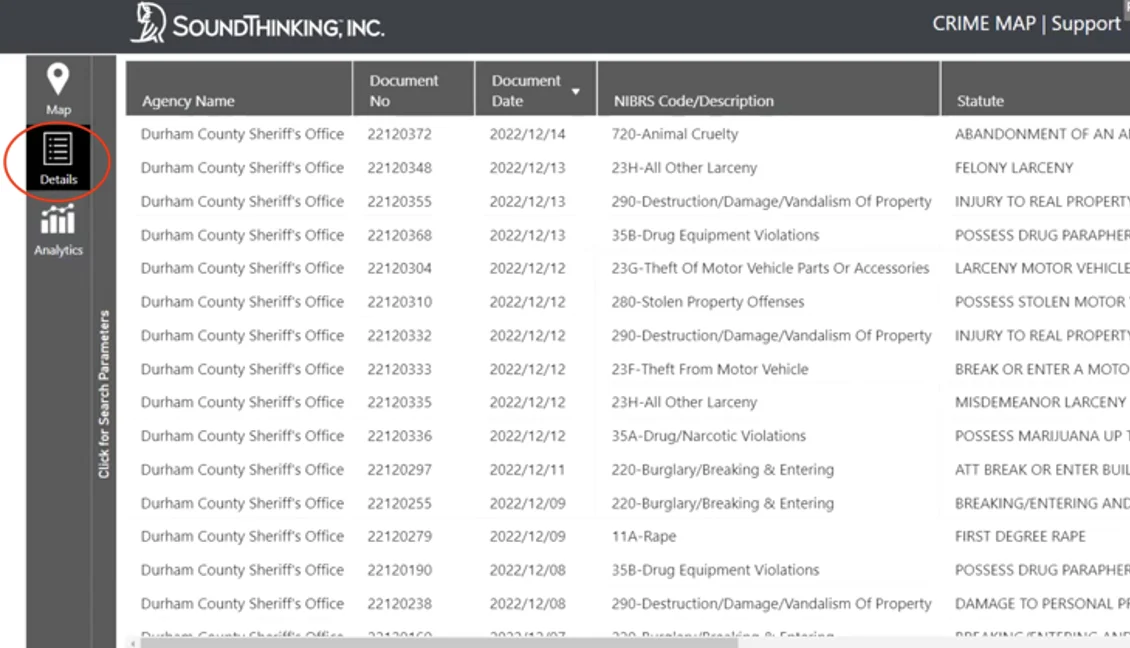
More Detailed Information in the Details Section
The Details view shows the agency, the date of the crime, the crime code, a description of the statute as well as the street-level address, state, and zip code.
Analytics Pane
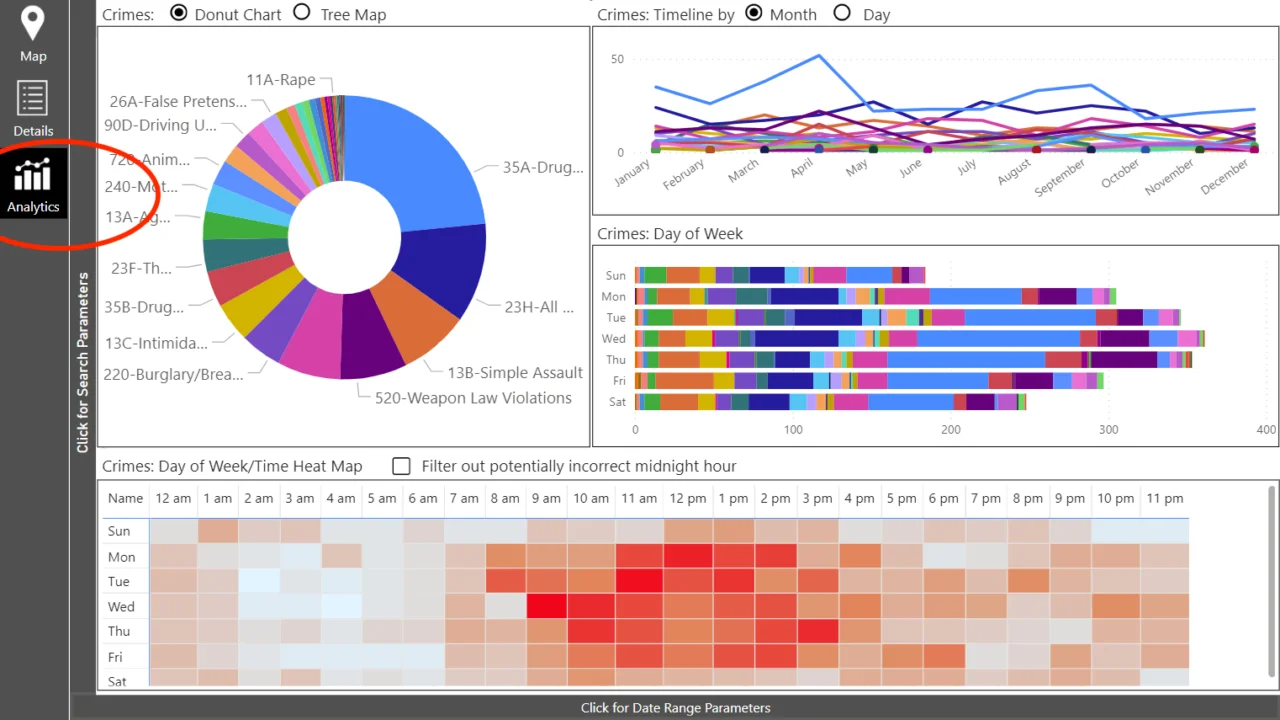
The analytics pane makes it easy for the public to see larger crime trends in the community. Specifically:
- The donut chart displays a breakdown of crimes by crime types.
- The chart on the upper right demonstrates crime trends, by crime type, over time.
- The Crimes: Day of the Week chart displays the prevalence of different crime types broken down by the day of the week.
- The Heat Map displays the prevalence of crime hour by hour.
Empowering Communities with More Information
Across the country, agencies are shifting from traditional policing to community policing, recognizing that the responsibility of building and maintaining community safety should not rest on law enforcement alone. Information is power, and with public access to crime data impacting communities, the public can work more effectively with law enforcement to determine what additional resources (and/or second responders) are needed in the area to improve quality of life and keep everyone safe.
To access the Crime Map, contact your local police department to find out if they are currently a CrimeTracer customer.


