Most agencies already have the raw ingredients for strong crime analysis to determine trends: CAD, RMS, field interviews, BOLOs, partner records, and public records. The challenge is quickly and efficiently turning all that activity into a clear, citywide picture you can trust, then getting it in front of the right people in time to act.
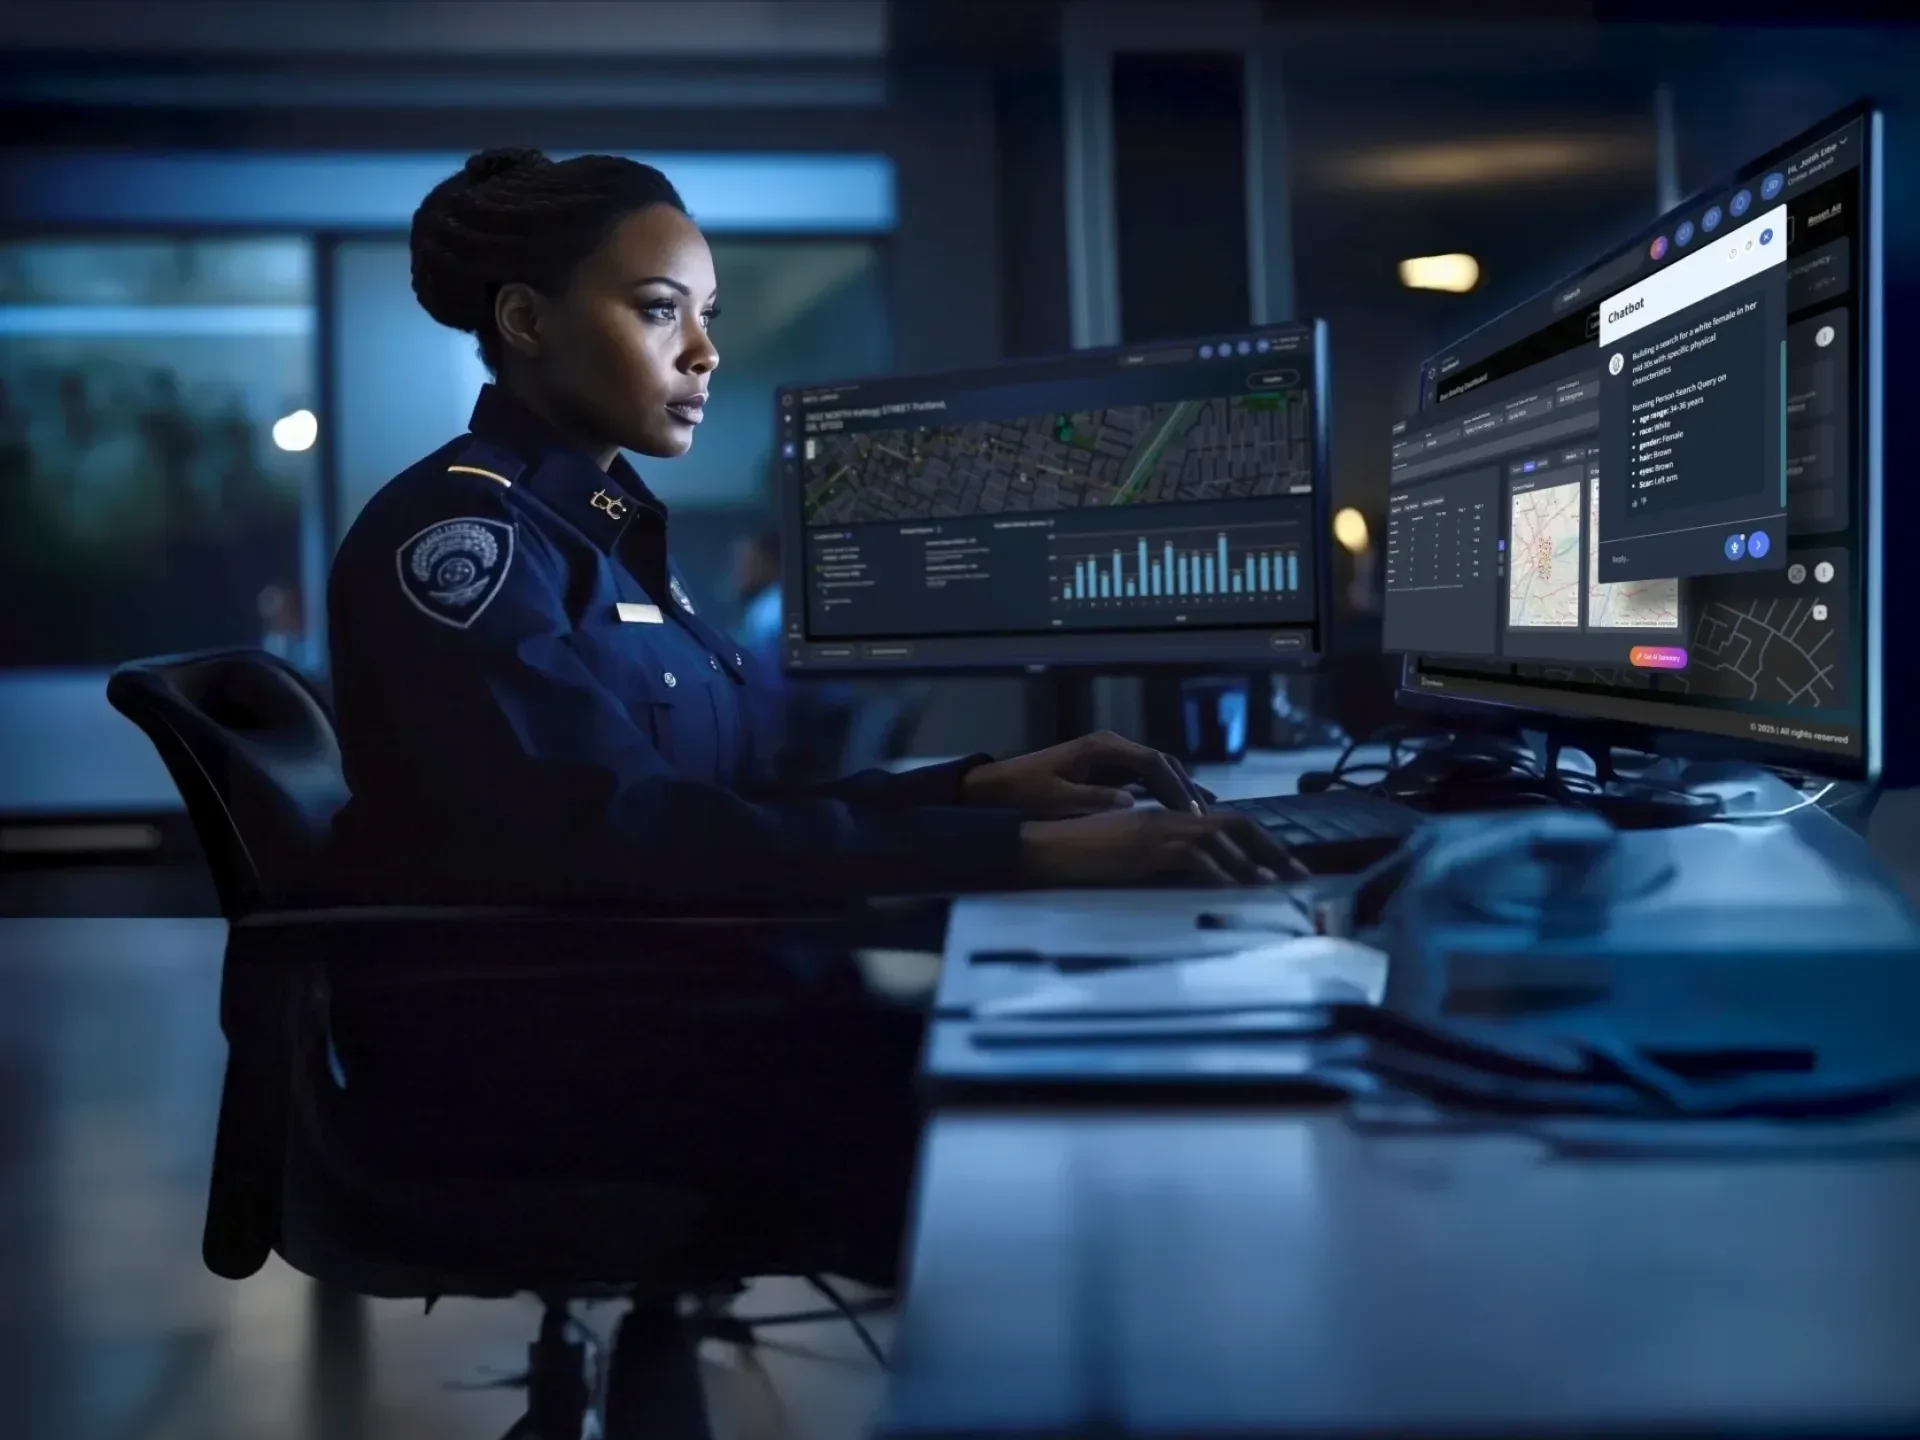
The trends dashboard in CrimeTracer™ Gen3 is built for that moment. It gives analysts and command staff a dynamic, citywide view of crime counts, trends, and hotspots, allowing them to spot emerging patterns and drill directly into the underlying incidents.
Why Trends Dashboards Matter in Modern Policing
Data is not something public safety agencies lack. Agencies juggle multiple databases that are often siloed and not integrated. Taking time to search for the same information across several sources and toggle between data sets to make connections and correlations is arduous and time-consuming.
Even with data integration, seeing crime trends can become difficult. Data may arrive in waves, with important aspects lost in email threads, trapping needed hotspot awareness in outdated systems. When trends are being cultivated on data that doesn’t represent the current picture, command meetings focus on what happened, not what is developing, and patrol briefings may not reflect the latest patterns, especially across patrol areas and shifts.
What the Trends Dashboard Does Inside CrimeTracer Gen3
At its core, the trends dashboard is a citywide visualization layer that helps you:
- See counts and trends across your jurisdiction
- Identify hotspots and clusters
- Filter quickly by date, offense, patrol area, and shift
- Drill into the underlying incidents when something changes
This is not a static report. It is an interactive workspace designed for command staff and analysts to move from “something is spiking” to “here are the incidents, the common factors, and the operational next step.”
Finding a Pattern Early
The trends dashboard shows a spike in vehicle thefts in a specific area, peaking between midnight and 4 AM. Using the CrimeTracer Gen3 trends dashboard, analysts or patrol command staff can quickly identify key details across multiple reports with AI summaries. Vehicle information and suspect descriptions can be quickly searched in the voice-enabled chatbot, and any records linked to the trend can be saved to a case folder in CrimeTracer Gen3.
Sharing the trends dashboard information with patrol officers, especially those assigned to the area where the hotspot is during peak times, equips them with the data and context needed to proactively patrol. With that information, patrol has better situational awareness in the area, which can help lead to an arrest and the recovery of stolen property.
Watch the CrimeTracer Gen3 Webinar On Demand
How the Trends Dashboard in CrimeTracer Gen3 supports CompStat-style Briefings
Many law enforcement agencies run some version of CompStat today, either formal, informal, or both. Whether it’s weekly reviews, zone meetings, stat sessions, or command check-ins, the trends dashboard can help inform and strengthen this data.
- Create and save multiple dashboards: Instead of rebuilding dashboard views, create and save dashboards tailored to your agency’s workflow. Set up separate dashboards by crime type, hotspot area, patrol area, or other agency-specific criteria. Instantly pull up those saved dashboards for patrol briefings, investigative updates, CompStat-style reviews, or other meetings—so the right view is always ready and at your fingertips.
- Faster preparation with fewer “data wrangling” hours: Rather than building trend views from scratch each week, you start with a dynamic citywide view that quickly visualizes trends and hotspots.
- Better questions, grounded in underlying incidents: Trend lines are not enough. The value comes when you can drill down, review the incidents contributing to the trend, and efficiently validate what is actually trending, all in one place.
- Clear information sharing with patrol and investigations: CompStat works best when it produces assignments, not just discussion. Sharing trends and associated findings with patrol and investigations ensures everyone has the most up-to-date information.
Where Does the Trends Dashboard Fit Within the Gen3 Workflow?
Trends are more powerful when they are connected to the rest of your intelligence stack. CrimeTracer Gen3 positions the trends dashboards alongside tools that help teams quickly search, refine parameters on the fly, summarize long reports to save time, and organize investigative leads and connections.
The trends dashboard is more than just an overview of crime in your jurisdiction. The trends dashboard can change daily operations in quiet but meaningful ways by sharing emerging patterns earlier with patrol officers, aligning analysts and patrol, ensuring trends and patterns are easily discernible and quickly validated, and enabling patrol deployment decisions based on the most recent trend data rather than relying on briefing pass-down notes.
Trends Move Fast – So Should Your Analysis.
Today’s crime patterns rarely wait for the next weekly meeting or the next report cycle. When trends emerge, the agencies that respond fastest are those that can see what is changing, validate it quickly, and provide clear direction to patrol and investigators before the next shift starts.
That is the role of the trends dashboard in CrimeTracer Gen3. It turns citywide activity into a shared, current picture of where problems are emerging, what is driving them, and what to do next, without forcing analysts and leaders to piece together the story across disconnected systems.
If you are ready to strengthen CompStat-style briefings, tighten shift-to-shift awareness, and move from trend detection to action with less friction, contact us to learn more about CrimeTracer Gen3. See how the trends dashboard, AI summaries, chatbot search, and case folders work together to help your team make faster decisions, deploy smarter, and close cases with better context.